7.1 Score
Runs Scored
= .5 (B + P) +
HT + SP
rounded to the nearest integer
Where:
- B = Your Batting score - defined below
- P = Opponent's Pitching score - defined below
- HT = .33 run added for home team
- SP = Superior pitching performance by opponent.
- -4 for a complete game perfect game.
- -3 for a complete game no hitter.
- -2 for complete game shutout
- -1 if multiple pitchers used and give up 0 runs
combined
- -.25 for other complete games.
- Otherwise it equals zero.
Notes: "Complete game" refers a starting pitching
performance of 9 or more innings (regardless of whether the
actual major league game goes longer or whether a pitcher
completes a rain-shortened game). In checking for no
hitters and perfect games, the starting pitcher must
complete 9 or more innings. Then we check to see if
the pitcher gave up any hits. If hits = 0, and walks
allowed = 0, we're going to count this as a "Perfect Game" -
otherwise 0 hits will equal a "no hitter." In
practice, we don't get a no hitter/perfect game indicator in
the stat service, so this allows for automated scoring.
Jonathan Sanchez' no hitter in 2009 included an error by the
Giants, but we're not keeping track to that level...and for
his part of the effort, it was as perfect as he could
get...so the BWB scoring system marked it as a perfect game.
(Notes added 9/5/09)
TIES - Because "Runs Scored" will always be an
integer, there exists the possibility that some games will
end in a tie. The real winner of any game is the one with
the higher raw score – regardless of how many decimal places
are required to determine that. In order to make the game
result appear normal, one run will be added to the winning
team OR one run will be subtracted from the loser in order
to create a 1-run margin (the adjustment that produces the
displayed total runs for both teams closer to the actual raw
total will be used). To signify how close this game really
was, the game will be flagged as an “extra inning game.”
7.2 Batting Score
B = .5(RR + ATB) + .5(HR)
Where:
- RR = Runs/RBI factor – defined below
- ATB = Adjusted Total Bases – defined below
- HR = Total Home Runs for team
7.2.1 RR
This is essentially the number of runs a player scores
multiplied by the RBIs of the next three batters after him.
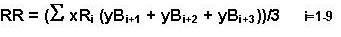
Where:
- R = Runs Scored by a Player
- B = RBI (for the next three players in the
order)
- x = Runs multiplier – based on batting order
- = 1 except for batters in positions:
- 1 = 1.3; 2 & 3 = 1.2; 8 & 9 = .9
- y = RBI multiplier – based on batting order
- = 1 except for batters in positions:
- 3 = 1.3; 4 = 1.4; 5 = 1.3; 8 = .9; 9 = .8
NOTE: This formula “rolls over.”
Although it’s listed as i = 1-9, as i+1, i+2, and i+3 go
above 9, the formula actually rolls over to the #1 position
again. So, the runs of the first batter in your order
are combined with the RBIs of hitters #2, #3, and #4.
The runs of your 8th hitter in the lineup are combined with
the RBIs of hitters #9, #1, and #2.
7.2.2 ATB
This value takes into account a player’s hits, extra base
hits, and other methods of reaching base or advancing (BB,
HBP, and SB).
ATB = (∑(zTBi
+ SBBi))/3
i=1-9
Where:
- TB = Adjusted total bases for a player: TB + BB
+ HBP + SB
- z = Total bases multiplier – based on batting
order
- = 1 except for batters in positions:
- 1 & 2= 1.3; 3 = 1.1; 8 & 9 = .9
- SBB = Stolen Base Bonus - based on
batting order
- = (SB * .25) for players in batting order slots
1 & 2
- = 0 for players in batting order slots 3-9
Note - SBB portion of the
formula has been in existence since 2001, but was missed
when converting original scoring spreadsheet to written
rules. Added here on 8/7/14.
7.3 Pitching Score
P = ER + (BP * BI) – a ( K + BK) – ((b
* S) / NumCl) + HBB + c (E)
Where:
- ER = number of earned runs allowed by starting pitcher
- BP = Derived Bullpen earned runs - defined below
- BI = Number of innings pitched by the bullpen –
defined below
- NumBP = Number of Relievers used in the game - see
below (no longer
used in formula but definition retained for future needs)
- NumCl = Number of Closers used in the game - see
below
- K = Strikeouts by starting pitcher
- BK = Derived bullpen strikeouts – defined below
- S = Accumulated saves by 1st and 2nd relievers
(counted only if they are used in a game)
- HBB = Hits/Walks adjustment - defined below
- E = Total errors by position players, other than the
DH. (Benchwarmer Batters make 2 errors).
- a = strikeout multiplier = .1
- b = saves multiplier = .5
- c = errors multiplier = .5
Note 9/5/09 and 7/18/14 - The formula was updated
twice in the rules pages to match the actual program code
that scored the save portion of the pitching scores. These
were not actual rule changes, but the save part of
the formula had been reproduced incorrectly in the written
version of the rules. (See
2009 rule
changes and
2014 rule
changes for details).
Note 12/23/14 - For 2015 there is an actual
formula change for scoring saves. See the
2015 rule
changes for a full discussion of the change. The
formula on this page is the current version in effect.
7.3.1 BP
Basically this is a cumulative value of Earned Runs per
Inning Pitched by the Bullpen
BP = Sum of the needed relievers’ ER over the last six
games / Sum of the needed relievers’ IP in those games . (“needed relievers” is defined
below)
(This formula is slightly different than the one in the
hardcopy of the rule book. This version is correct)
7.3.2 BI
BI = Bullpen innings = 9 – Starter’s IP.
7.3.3 BK
BK = Bullpen strikeouts = Accumulated K/IP for the number
of relievers needed, times BI.
(This formula is slightly different than the one in the
hardcopy of the rule book. This version is correct)
7.3.4 HBB
HBB is an adjustment based on the total number of hits
and walks allowed by the team. For the starting pitcher,
that is simply the number he allows in his start. For the
bullpen, the number of hits and walks per inning is
calculated for the relievers that are used in the scoring
formula. This value is then multiplied by the number of
bullpen innings (BI) and rounded to the nearest integer.
|
Total Hits + Walks
allowed |
HBB |
|
8 or fewer |
-.33 |
|
9 |
-.25 |
|
10 |
-.1 |
|
11 to 13 |
0 |
|
14 |
.25 |
|
15 |
.50 |
|
16 or more |
.75 |
7.3.5 Determining the number of relievers
Modified for 2022 Season
Relief pitching is determined by the number of innings
the starter pitches.
Relievers are defined in the roster as:
- R1 – Closer
- R2 – Set up man / Backup closer
- R3 – Set up / Middle relief
- R4 – Middle reliever
- R5 and R6 – Mop up / Long relief
If the starter goes 9 innings, no relief stats are used.
If the starter pitches less than 9 innings, the bullpen
use is as follows: Minimum IP modified 1/14/10
|
Starter Pitches: |
Relievers Used* |
Minimum IP** |
Eligible Saves*** |
|
8 to 8 2/3 |
1 |
1 2/3 |
R1 |
|
7 to 7 2/3 |
2 |
4 1/3 |
R1 & R2 |
|
6 to 6 2/3 |
3 |
8 |
R1 & R2 |
|
5 to 5 2/3 |
4 |
10 2/3 |
R1 & R2 |
|
4 to 4 2/3 |
5 |
12 2/3 |
R1 & R2 |
|
Less than 4 |
All 6 |
15 |
R1 & R2 |
*Relievers used always starts from the top. If a listed
reliever does not pitch in the six previous games, all
others move up a spot to fill his place. For example, if 3
relievers are needed for the game, and R2 does not have any
qualifying appearances, then R3 will move up to the R2 spot
and the listed R4 will move up to R3.
** If the reliever, or group of relievers, does not reach
the IP minimum, 1 ER is added to ER total for each inning or
part of an inning less than the minimum. The minimum is then
used as the denominator in the BP function. This number is
tallied up for all six games used in the formula for relief
pitching. (Before this season, the minimums were last modified for 2005 season).
*** For use in the main pitching equation. Only the saves
for the top two relievers used in a game are ever counted in
the scoring formula.
Spot pitchers with eligible relief appearances will fill
in for a reliever with no qualifying games, starting at the
bottom of the bullpen.
Clarifications January 2010 on Relievers moving up:
1) When you have bullpen pitchers missing time, the "R1"
and "R2" designation for saves is dependent upon the
pitchers in that game for you, not their original lineup
designation. Example: In your game, you require 3
relievers and your bullpen is: R1-Joe Nathan, R2-Huston
Street, R3-Phil Coke; R4-Craig Breslow (not needed in this
game). Normally, you would only get credit for saves
from Nathan and Street. But let's say that Street
hasn't pitched in the previous 6 MLB games, so none of his
stats count. For this game, your bullpen is now:
R1-Nathan, R2-Coke, R3-Breslow. If Coke has any saves,
they will count for the game.
2) On the spot pitchers taking a bullpen role in a game.
Same example as above, but now you need 4 relievers for your
game score. Your R5 is Scot Shields and let's say he's
injured and not pitching, so although he moves up to R4,
there are no stats for him. You have Ian Snell at Spot
Pitcher 1 and J.C. Romero sitting at Spot Pitcher 2.
Snell doesn't have any relief appearances, but Romero does
and for this game, he fills the role of R4.
7.3.6 Determining the Number of Closers (2015 modification)
As mentioned above, only the saves for the top two
relievers used in a game are ever counted in the scoring
formula. From 2000 to 2014 the save portion of the
score was divided by the number of total relievers used in a
game - which eventually was determined to be incorrect.
The score you get for saves should not be different if you
use 2 or 5 relievers - since you can only count saves earned
by at most 2 pitchers.
|
Number of Relievers |
Number of Closers |
Eligible Saves* |
|
1 |
1 |
R1 |
|
2 |
2 |
R1 & R2 |
|
3-5 |
2 |
R1 & R2 |
*Eligible Saves: Which saves to count? What if your closer
is demoted? Changes in closer roles can be
quick and you may not be able to change your lineup in time.
It could be an injury or could just be a manager's decision.
So, if one of your top two relief pitchers used do not have
any save opportunities in the 6 games of bullpen stats used
to score a BWB game, we'll check with your 3rd pitcher in
line to see if he had any saves.
- We use this on the top 2/3 relievers used in the
game. If one of your closers doesn't pitch at all
in those 6 games, we're already moving up the other
relievers in the lineup/game scoring. If your R2
is out, then the R3 moves up and is the R2 in terms of
that game, your R4 moves up to be considered R3.
- Based on our MLB stats, "save opportunities" = 0
Saves + 0 Blown Saves
- This is not reordering your bullpen. If your
R1 has no save opportunities, we still must get to using
R2 and R3 in the game before we count their saves.
- Even if we get down to the 3rd reliever in this
case, the "number of Closers" (NumCl in the score
formula) is maxxed at 2.
7.4 Benchwarmers
7.4.1 Benchwarmer Batters
For each spot in the starting lineup that is not filled -
either by the listed starter or by a player off the bench, a
Benchwarmer Batter becomes the substitute. The
Benchwarmer’s statistical performance for the game is: 0 for
5, no RBI, no walks, no SB, 2 errors.
7.4.2 Pinesitter Pitcher – Starting Pitcher
If the normally scheduled starter cannot pitch in the BWB
game (whether because there are no starts in the queue or he
has not had the proper rest), and no spot starter can fill
in, and no other pitcher in the rotation can move up to
pitch early, then a substitute is needed to start the game.
If no starters qualify for the game, a Pinesitter
Pitcher fills in with the following line score: 3
IP, 5 H, 5 BB, 0 K, and 5 ER.
7.4.3 Pinesitter Pitcher - Bullpen
Formula modified for 1st Pinesitter 1/14/10 - 6th
Pinesitter added in 2022
For each reliever a team is short of the relief pitchers
needed, (that is, no appearances eligible for the current
fantasy game), a Pinesitter Pitcher will come
in from the bullpen. The performance of this extra pitcher
will depend on how many Pinesitters are necessary to fill
the entire complement of relievers needed for the game. The
first Pinesitter used will be mediocre/below average, while
additional extra relievers will get progressively worse.
The stats “earned” by each Pinesitter:
|
Pinesitter # |
IP |
H |
BB |
ER |
ERA |
|
1 |
4 |
5 |
3 |
3 |
6.75 |
|
2 & 3 |
5 |
5 |
5 |
5 |
9.00 |
|
4 |
3 |
4 |
4 |
4 |
12.00 |
|
5 & 6 |
5 |
10 |
10 |
10 |
18.00 |
Keep in mind, that the bullpen score is a derived average.
So the earned runs given up by Pinesitters don’t go straight
to the bullpen line, but instead work to increase the runs
per inning average (the “BP” portion of the pitching score).
|